For a long time Varnish developers wanted a monitoring tool with a feature set similar to Apache’s mod_status, which lets you monitor the status of threads. Varnish is already well-served by several other, similar utilities: varnishstat, which shows internal counters, and varnishlog, which stores session information related to serving a request.
One of the initial requirements was to ensure that this new tool avoided duplicating the information these existing Varnish tools provide.
Why Varnish Score Board?
When we put together the Varnish Score Board, we envisioned a tool that would provide an overview of how a server is performing, and moreover, thought it would be handy for debugging and looking up hanging threads. And for now, for its initial release, that’s pretty much what it does.
The varnishscoreboard utility displays thread statuses from a running varnishd(1) instance.
Take a look at an example output, displaying each active thread’s status in the columns and a summary of the number of threads running/in pool/max on the bottom line:
Age Type State VXID sesVXID IP:Port Request
11.92s CLIENT FETCH 5505038 1079246861 xxx.xxx.xxx.xxx:51072 /index.html
1.80s BACKEND STARTFETCH 5308435 1079050258 xxx.xxx.xxx.xxx:51234 /login.html
1.85s BACKEND STARTFETCH 5013521 1078755344 xxx.xxx.xxx.xxx:51150 /pictures.html
6.92s BACKEND STARTFETCH 4030567 1077772390 xxx.xxx.xxx.xxx:50004 /index.html
...
11.88s CLIENT FETCH 6455320 1080197143 xxx.xxx.xxx.xxx:51096 /news.html
11.87s CLIENT DELIVER 6684686 1080426509 xxx.xxx.xxx.xxx:51100 /pictures.html
1.88s BACKEND STARTFETCH 6717463 1080459286 xxx.xxx.xxx.xxx:51084 /index.html
Threads running/in pool/max: 42/200/10000
varnishscoreboard allows you to monitor which resource is currently requested, and alongside VXID and varnishlog, you can easily get more information.
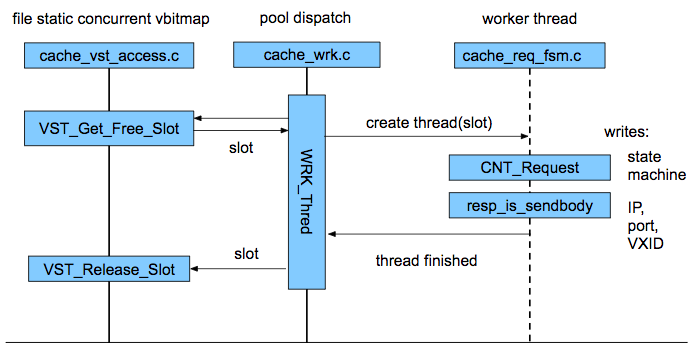
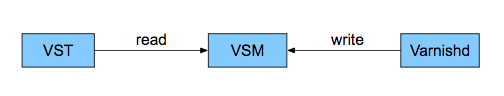
Under the hood, varnishd reserves a number of slots, equal to the number of threads configured, in the Varnish Shared Memory, and each new thread requests a slot at creation and writes updates on its status into it. With the default value of thread_pools = 2 and thread_pool_max = 5000, this is an extra ~2.85M.
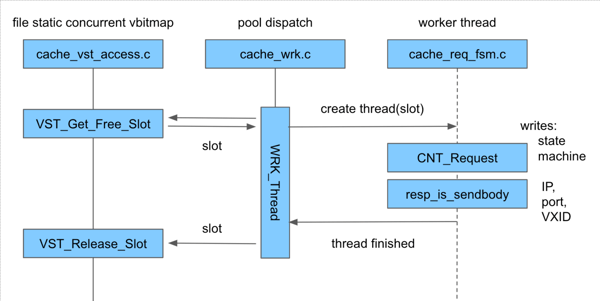
Since there is no locking involved at writing and reading, no performance penalties are introduced.
As this is a new feature, and it changes the default varnishd behavior by allocating more memory, it is disabled by default by the parameter: scoreboard_enable. After enabling the parameter, varnishd needs to be restarted.
Another parameter, scoreboard_active can allow or forbid threads from requesting a slot to update their statuses. It requires scoreboard_enable to be on.
The feature is part of the varnish-plus-6.0.4r3 release.
Tell us what you think
This tool is new, and as stated above, is designed to aid in debugging and looking up hanging threads. But what other applications could it have? How would you like to use varnishscoreboard? Do you have feature requests that could improve the tool’s usefulness? We'd love to hear your thoughts in the comments section below.


