In this post I will shed some light on Varnish Cache memory usage. In particular, we will examine the malloc storage backend and tune jemalloc for optimal usage.
Storage Backends
First, let's review how Varnish Cache actually stores its content. Varnish Cache stores content in pluggable modules called storage backends. It does this via its internal stevedore interface. This interface accomplishes a few things. First and foremost, it gives the storage backend tremendous flexibility in choosing how to store content. Secondly, it makes sure that the storage backend adheres to Varnish Cache's high performance nature. Finally, it allows Varnish Cache to run multiple storage backends concurrently, even multiple instances of the same type. This has led us to the current crop of disk and memory-based storage backends. For disk based, we have file and Massive Storage Engine (mse) and for memory based we have malloc.
Why I went over this is because the malloc storage backend is actually quite simple in its implementation. (I will gloss over some details for simplicity's sake.) For every object that goes to malloc for storage, it in turn asks system malloc() for that exact amount of space. This is a linear contiguous address space allocation. When Varnish Cache instructs the storage backend to delete the object, malloc issues a system free() on that original space. Basically everything is being mapped to malloc() and free(), which explains why it's called malloc. More on this later.
Overhead and Fragmentation
So if you have a server with a certain amount of memory available for Varnish Cache, how much of that memory do we allocate to malloc? The conservative answer is 75%. So if we have 32GB of memory available, it's recommended to only give malloc 25GB. Why? Overhead and fragmentation.
First, we have to account for memory that Varnish Cache needs outside of storage. This is called overhead. Varnish Cache has 1KB overhead per object. So if you have 100,000 objects, Varnish Cache will require 100MB of memory to manage it. We also need to make sure we have enough memory for other things like thread stacks, request workspaces, and everything else that requires memory. Even the memory allocator requires upfront space. We can conservatively estimate this at around 100MB (default configuration). Together, we can estimate about 5% of the total storage size.
The second factor in our memory calculation is fragmentation, in particular, fragmentation waste (unusable memory). In a perfect world, malloc() would be able to fulfill each and every one of our memory requests with a perfectly fitted linear address space. However, that's not possible. There will be bytes lost due to alignment and padding. When we start recycling memory via free(), fitting issues start happening due to the fact that the pool of available memory is no longer a nice linear address space. This is called fragmentation and it leads to blocks of memory going to waste. There is also the issue where reducing fragmentation is computationally expensive, so if we want a very fast and concurrent allocator, we will have to accept greater levels of fragmentation.
There is no standard way to track fragmentation from the system allocator, so the malloc storage backend cannot account for it. It only tracks bytes in and out of malloc() and free(). So if our system allocator uses more memory than we asked for, we need to account for that when planning overall memory usage.
Finally, not all memory allocators are equal. Varnish Cache uses jemalloc as its default memory allocator. Jemalloc is fast, efficient, and very stable. It also does a better job than most in fighting fragmentation. Jemalloc has worst case memory fragmentation of 20%.
This gives us the second part of our equation. When we account for overhead (5%) and worst case jemalloc fragmentation (20%), that gives us 25% of memory we need to reserve for non storage. Put another way, only 75% of available memory should be allocated for actual malloc storage.
Tuning Jemalloc
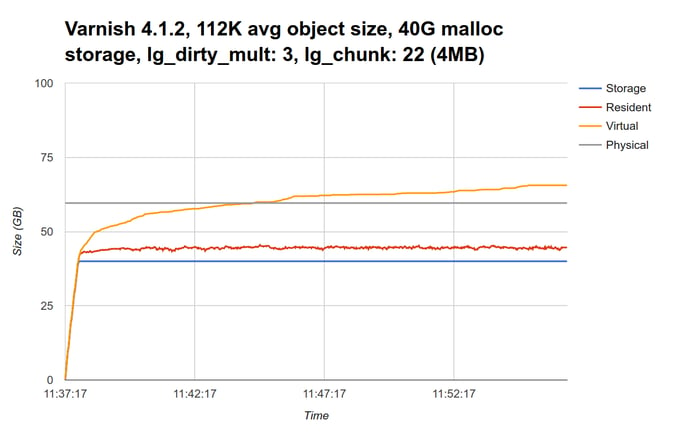
If you are using the malloc storage backend, this graph may look familiar:

The red line represents the total amount of resident memory Varnish Cache is using (approximately 45GB). When we compare this with the storage size (blue line, 40GB), fragmentation waste is right around 10%. We also see very high virtual memory utilization (yellow line), which is mainly comprised of untouched zero pages. This explains why it goes above the physical memory limit (grey line).
Luckily, we have a few options available to us in the form of jemalloc tuning parameters. (Note that the following parameters have only been tested with jemalloc 3.6.0.) Without going too deep into implementation details, jemalloc arranges itself around precomputed object classes based on size. This limits fragmentation while greatly increasing performance. How your allocations fall into these object classes will determine the amount of fragmentation you see.
The first thing we can tune is lg_dirty_mult. This tells jemalloc how aggressively it should look for and return fragmentation waste to the kernel. The default ratio (or multiplier) is 3. Setting this to a value of 8 has a very positive effect on reducing fragmentation without too much CPU overhead. This value is safe on a wide variety of Varnish Cache storage and traffic patterns.
The second tuning parameter is lg_chunk. This sets the internal chunk size which is how jemalloc allocates the different object classes. If you carefully set this value to a few standard deviations larger than your average object size (or large enough for 80% of your objects), this parameter can also be very effective in reducing overall fragmentation and controlling virtual memory growth. In the case of a 112KB average object size, a value of 18 (256KB) was found to be optimal. (Please note that the correct value for lg_chunk is highly dependent on your storage and traffic patterns, so please test and monitor the effects of this parameter thoroughly.)
To put these parameters in place, we run the following command:
sudo ln -s "lg_dirty_mult:8,lg_chunk:18" /etc/malloc.conf(Note: the above setting will effect all jemalloc installations on the server, please see jemalloc tuning)
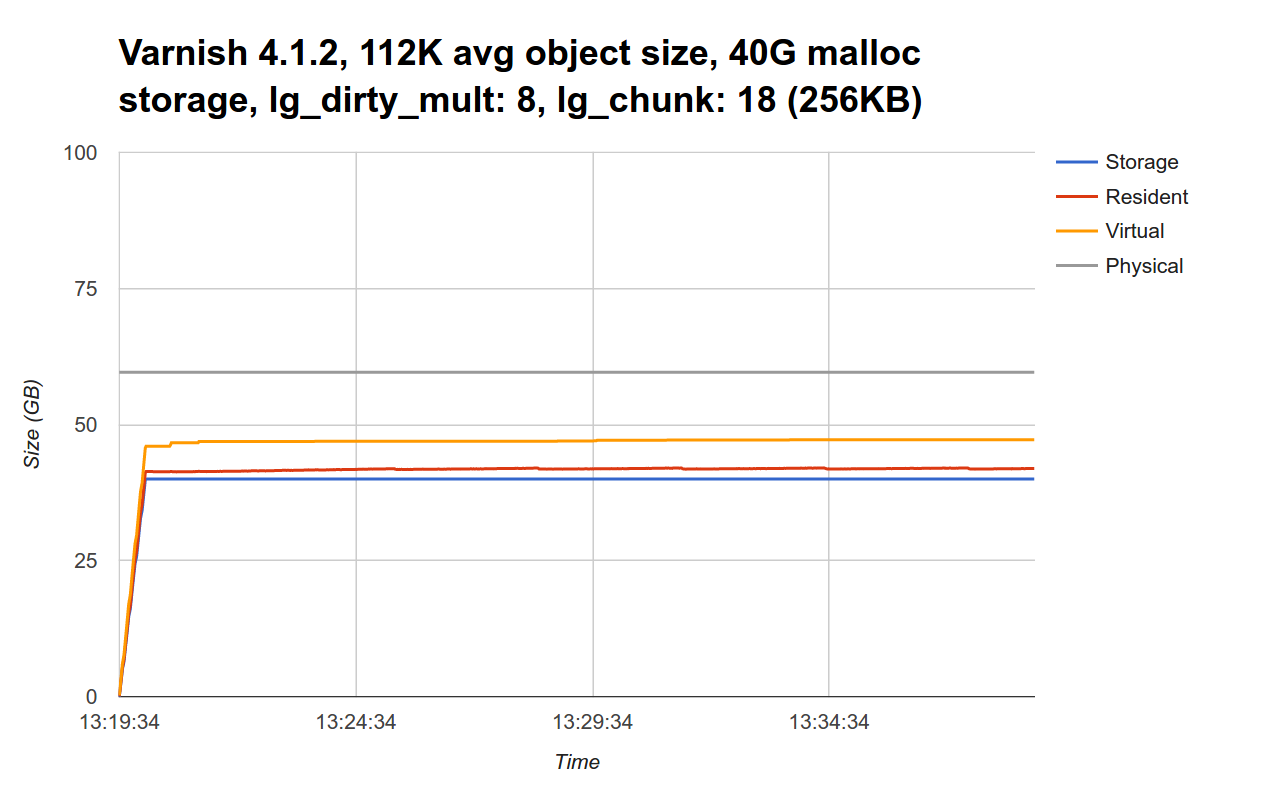
We now get this graph:

Memory fragmentation is almost non-existent, giving us back memory that would have been unusable. We also see that virtual memory usage is also in check. We can now bump up our conservative malloc sizing from 75% of available memory to 90% and still have room to spare. Note that with these jemalloc tuning parameters, Varnish Cache took around an 8% hit in overall performance.
If you would like to analyze how jemalloc is performing on your setup, there is a VMOD, located here, which will query and print jemalloc runtime statistics.
Circling Back
Is all of this necessary? Do we have to tune jemalloc to get optimal memory utilization? Absolutely not. Remember how I said that Varnish Cache has an internal stevedore interface that gives the storage backend a lot of implementation flexibility? Well, the storage backend is free to break objects up into more manageable pieces. It is not forced to store things in a linear and contiguous fashion. Infact, both the file storage backend and Massive Storage Engine (mse) do this. Massive Storage Engine takes this to the next level by implementing a fragmentation proof algorithm. It does not suffer from either fragmentation waste or data fragmentation. It exploits the fact that, unlike databases and filesystems, we have the option to evict data completely, and it does so using LRU zones. It also lets the kernel map and cache disk pages into memory for us. So we are combining the best of all worlds, in memory performance, minimal fragmentation, disk scale, and even optional persistence.
Photo (c) 2010 Eric Hamiter used under Creative Commons license.


