The days when Varnish has been used strictly for its caching capabilities are long gone, being such a versatile piece of software, its capabilities can be used to tackle more recent challenges.
How about microservices?
The past few years, the trend of designing web architectures has dramatically switched from huge monoliths to smaller and more specialised components.
From a development perspective, these smaller bits are easier to maintain and replace, should you need to.
Microservices are independent of their chosen technology - some may be written in Java/Python, others may pick the more hip golang.
While this approach has its vast set of advantages it does come with its drawbacks.
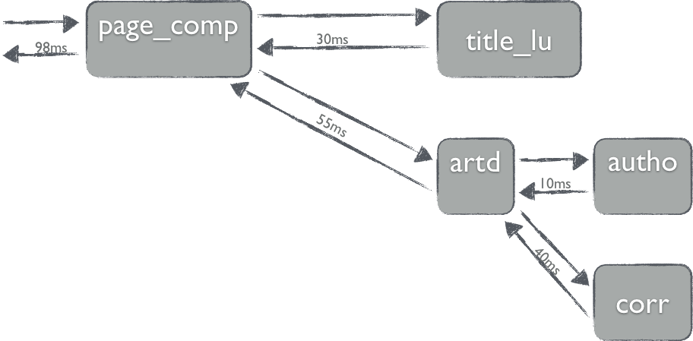
Probably one of the most difficult tasks is profiling and/or debugging a spiderweb of services. Imagine the following setup:

The call flow is rather long, from a client perspective - it's not a trivial job to determine which service call took the longest. Moreover, we can complicate things even more: suppose that a given service misbehaves only every 20th request!
Introducing Zipnish
In order to address such issues we introduced Zipnish a few months back. This tool is meant to be used instead of the conventional service discovery tools, up to some extent it does have the same approach as Twitter’s Zipkin, hence the name Zipnish.
Any request between the services will be routed through Varnish. This will add a major gain in terms of performance, as some service responses may be very good caching candidates.
Zipnish queries the varnishlog and extracts its required data in order to determine the hierarchy and between requests. The end result is a graphical interface that describes the order of requests along with their processing times, thus making the failing systems highly visible/obvious.
For more fine grained details on how to setup and use Zipnish consult the documentation. You can also learn more about Zipnish from our on-demand Zipnish webinar.


