One aspect of Varnish that customers and enthusiasts most often ask questions about is how to make more effective use of Varnish’s powerful logging features. Logging and log management is important because your logs can be a real-time account of what is happening behind the scenes with your web traffic and transactions, resource performance, and much more. The detailed nature of logs lets you identify specific issues, anomalies or patterns and troubleshoot, sometimes getting to root causes of problems or seeing and stopping threats emerge before they can do any damage.
Benefits of logging
It won’t come as a big surprise to developers, sysadmins or devops people: logging is key to understanding system behavior as it happens. Logs provide valuable data that enables the troubleshooting of problems and getting insight into everything from anomalous system performance to security threats, from proactive monitoring to improving operational or resource usage.
How Varnish does logging differently
Traditional logging, with its file-based, line-oriented approach is always familiar and sometimes enough, but it lacks the punch and features required to provide the best information possible. This is why Varnish does logging differently, and it logs a lot more data than a traditional system. But when you are dealing with millions of requests per second, that extra information could be a performance nightmare, saturating I/O and possibly slowing down traffic. Varnish solves this problem elegantly (and surprisingly!) by “taking logging out of the equation”, as I've recently explained in our webinar, Understanding Varnish Logging.
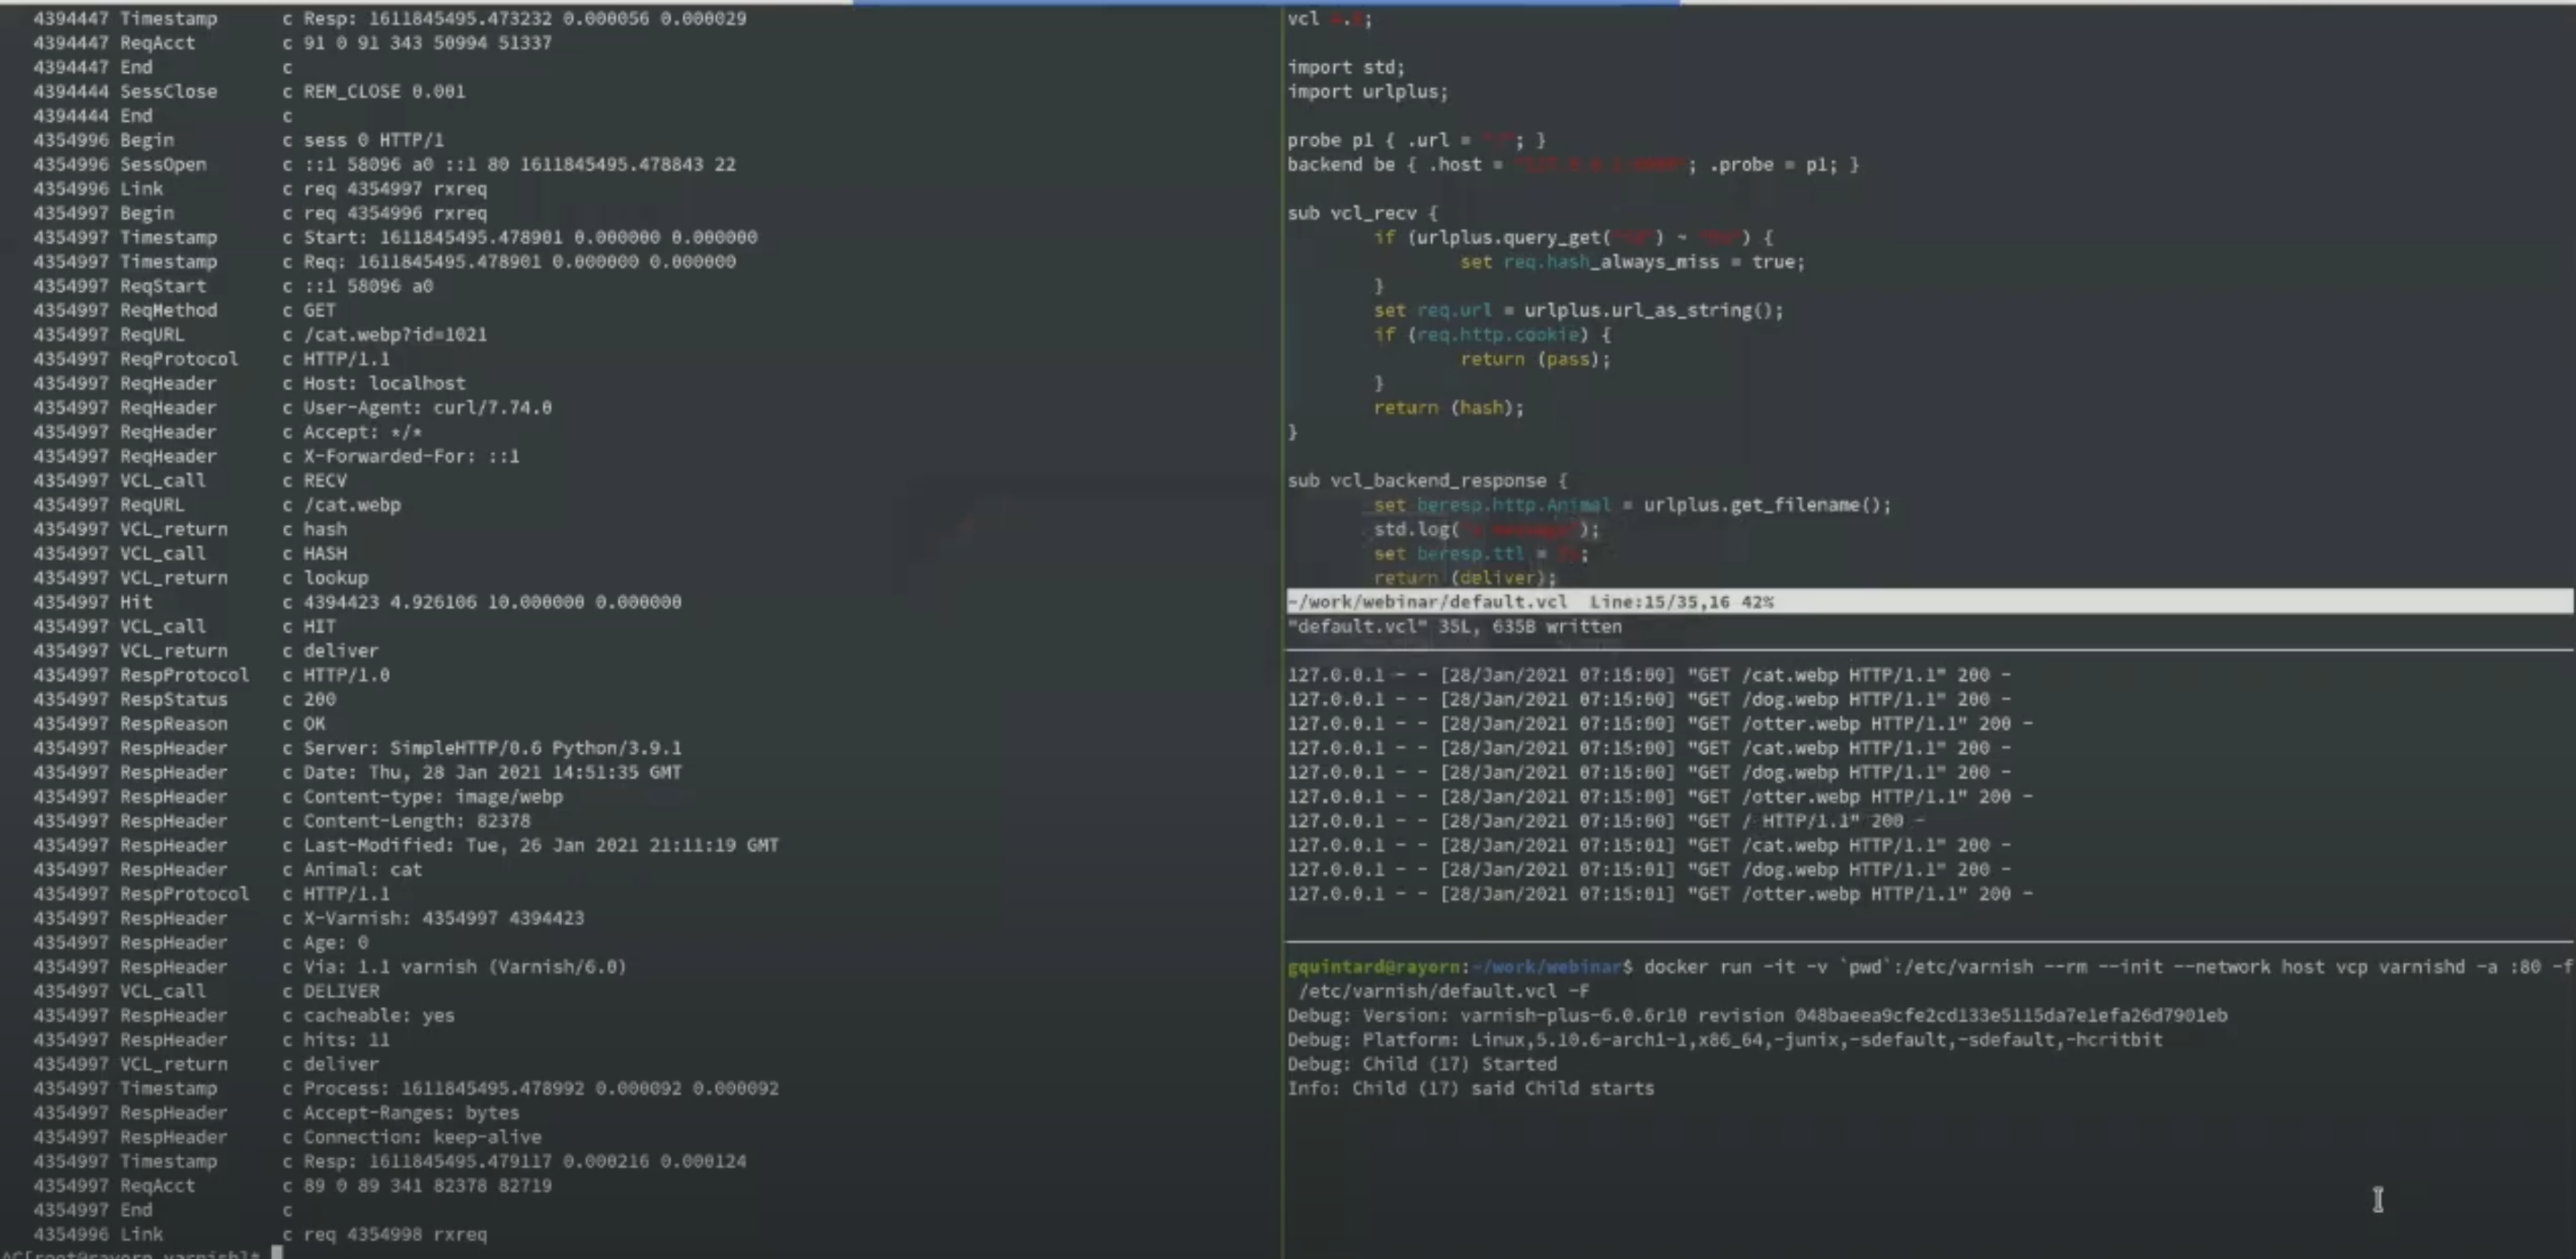
In the webinar, I explain that Varnish logs are pushed to the Varnish Shared Memory (VSM) component (in-memory: the fastest medium available), so you don’t get blocked by I/O, and Varnish is going to have a single purpose: to write (whether to a file, to the network), and you can use smaller programs (readers) that connect to VSM to transform the logs into a format that makes sense, e.g. varnishstat, varnishhist, etc.
In addition to providing a full background on how Varnish logging is different and why that’s a good thing, the webinar covers more of the basics of logging in Varnish, focusing on:
-
varnishlog for debugging
varnishlog, as stated, is a great tool for debugging. It lets you look into the VSM, and see real-time logs of actual traffic. The VSM is basically just one long stream of traffic records, and varnishlog helps to ease making sense of them. There’s a great deal of information about traffic and transactions that you can tap into here, and with Varnish, logging goes a level deeper than what is currently standard logging. That is, there can be dozens or even hundreds of records inside a single transaction, and Varnish captures all of this while most logging solutions capture just the transaction itself.
-
varnishncsa for accounting
When logging is done with only one line per transaction, there’s a substantial loss of information happening, but with varnishncsa, you get to decide exactly what to keep and what to throw away. Many users who rely on logging are using it for accounting and billing. For example, if you’re a CDN you need to know how many requests came in and what size they were (the same applies if you’re an API gateway). You don’t need to know everything Varnish does behind the scenes, but you need to know this traffic data. And that’s what varnishncsa does.
-
how you can build your own tools
And of course, Varnish being Varnish, there’s flexibility to build your own tools.
If you’d like to dig into the details, register to watch the webinar on-demand 👇