Follow The Rabbit
varnishstat
Latest Articles
- Guillaume Quintard
- September 24, 2024
Hello there! This article is the third part of a series, you may want to start at the beginning (The Basics), or at...
- Guillaume Quintard
- September 11, 2024
In our previous post, Varnish and Observability (Part 1: The Basics), we explored the Varnish ecosystem of core tools...
- Guillaume Quintard
- June 25, 2024
Is Varnish fast? Of course it is! I know that, you know that, but I want my friends, and my friends’ friends to also...
- Thijs Feryn
- January 18, 2022
In this week’s episode of Two-Minute Tech Tuesday, we'll talk about varnishstat, a tool that displays Varnish...
- Guillaume Quintard
- February 11, 2021
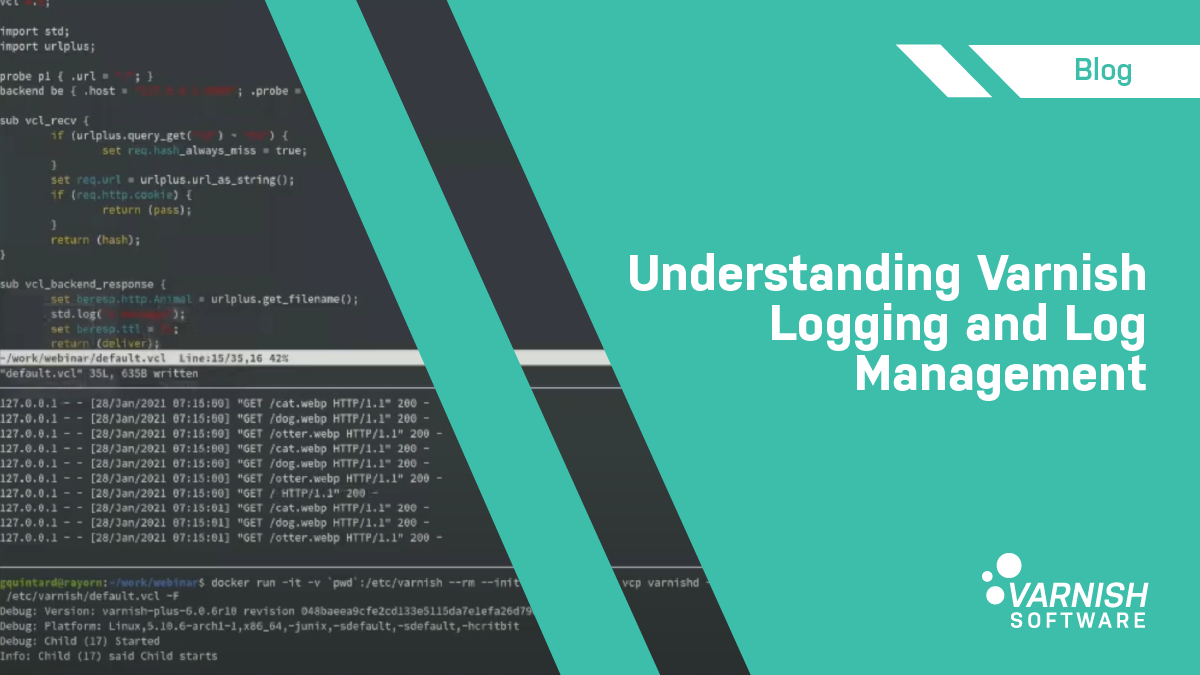
One aspect of Varnish that customers and enthusiasts most often ask questions about is how to make more effective use...
VCL
VMODs
ssl
Varnish API Engine
Varnish Cache Plus
varnishstat
varnishlog
grace in Varnish
probes
server health
load balancing
varnishadm
backends
TTL
TLS
configurability
- Guillaume Quintard
- July 26, 2016
This blog post is part one of a two-part series. (Find part two here.) Did you know that originally Quentin Tarantino's...
SUBSCRIBE TO OUR BLOG
SEARCH OUR BLOG
Explore articles from Varnish experts on web performance, advanced caching techniques, CDN optimization and more, plus all the latest tips and insights for enhancing your content delivery operations.


