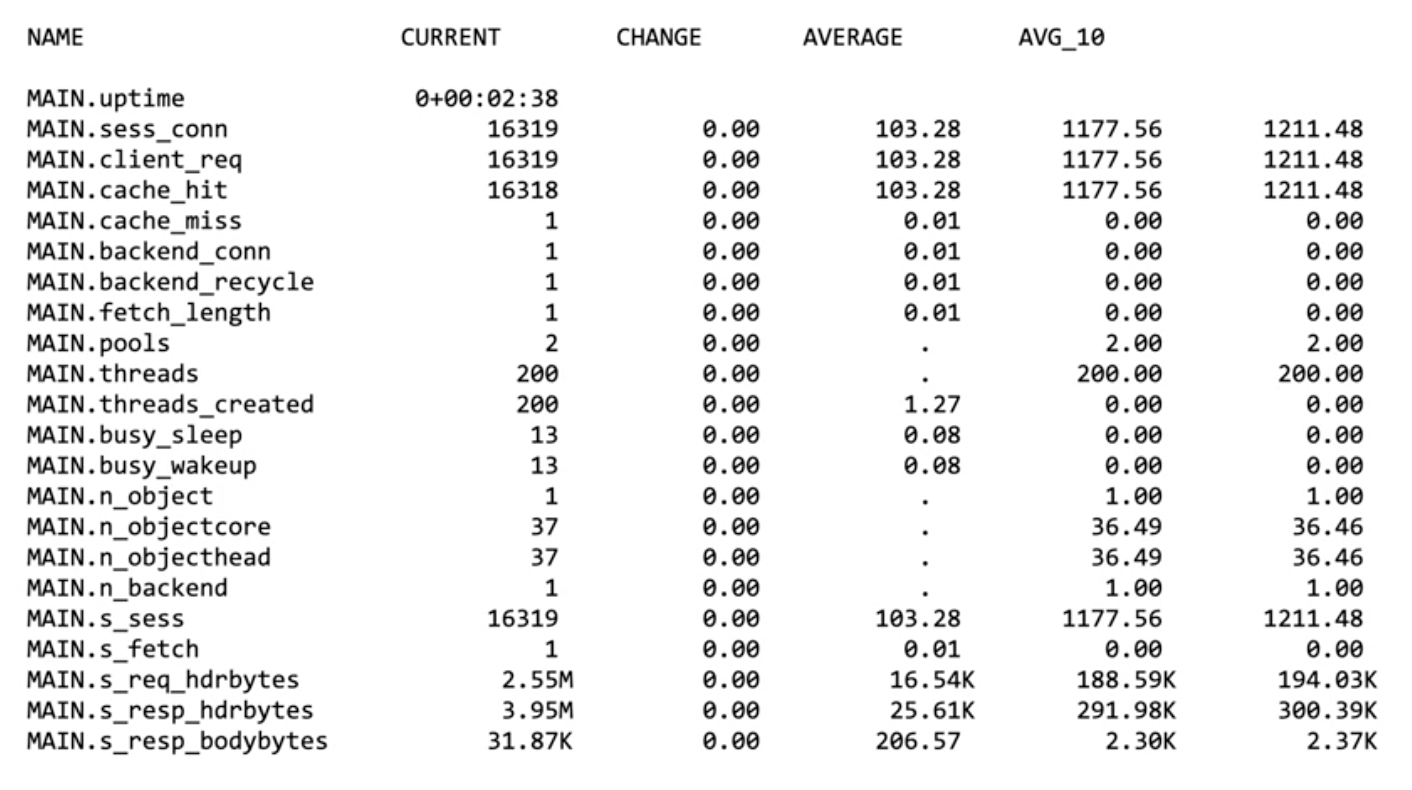
In this week’s episode of Two-Minute Tech Tuesday, we'll talk about varnishstat, a tool that displays Varnish statistics and counters (VSC).
These are kept inside the varnishd runtime process in a chunk of separate shared memory that we refer to as the Varnish Shared Memory (VSM). The counters that it presents range from information about:
- Processes
- Threads
- Connections
- Request information
- Caching status
- Backend communication
- Cached objects
- Input and output streams
- Object storage consumption
See the full list of statistics, here. This URL is part of the Varnish documentation and has the full list of counters, with all the information you need. When you run varnishstat on a brand new system that has just started, you'll see very few statistics. In this case, we have 2 thread pools — each of which has 100 threads:

- "MAIN.threads" is 200
- There's a single backend
- A single VCL file
- Only 1 ban on the ban list
- 100 MB of space that is allocated
But when the system starts receiving traffic, the counters get updated and there's more to see:
- The ratio between hits and misses
- The number of backend connections
- The number of objects in the cache
- The amount of bytes going in and coming out
- The amount of memory that is consumed

When you press the "D" key, varnishstat will also display zero-value counters. This will give you a lot more insight on what is available. The standard execution mode of varnishstat is curses mode, which presents a continuously updated list of statistics.
But when you add the "-1" parameter, the output will be dumped and will just give you snapshot of the current situation. You can also use "-j" to give it JSON formatting, or "-x" for XML formatting.
There are a lot of statistics and counters and that can be somewhat overwhelming. If you want to filter the output, you can use the "-f" parameter to limit the output and use individual keys or glob patterns. This command will filter for all the cache-related counters and will display them in curses mode so, you'll get a continuously updated list of:
- Cache hits
- Graces
- Hitpass
- Hitmiss
- Misses
varnishstat is truly an excellent tool to monitor the current state of your Varnish system and track down the evolution of specific counters. There are dozens of counters you can use, and if you run varnishstat manually, you can get all the information you want.


