As a company, we operate in the web acceleration and content delivery space. Our mission is to speed up the delivery of your web content.
In a more traditional sense, this involves accelerating your website or web application, but nowadays the web and the HTTP protocol that power it are also used for online video streaming and the transfer of large files.
Perceived loading speed
In a previous blog post, we referred to the Time To First Byte (TTFB), which is a metric that measures the amount of time it takes before the server starts sending its content. Our Varnish caching technology is built to reduce loading times and if you use Varnish your TTFB will be significantly lowered.

While a low TTFB can be achieved by caching, strategically positioning your Varnish servers in specific geographic locations can reduce network latency and can also have a positive impact on the TTFB.
But it’s not because Varnish can serve content to web clients in mere milliseconds that the user will experience it that way. The perceived loading speed might be way lower, despite a great Time To First Byte of the page itself.
This is all related to how the web browser decides to load the various hypermedia resources in the HTML code.
These hypermedia resources include:
- CSS files
- Javascript files
- Images
- Videos
- Web fonts
All of these resources contribute to the visual representation of the website and misplacement of certain hypermedia tags may cause render-blocking.
For example, Javascript code that is loaded in the <head> section of the HTML output might block the loading of an image in the <body> section of the HTML. If the image is more important for the visual representation of the website, blocking the loading will have a detrimental effect on the perceived loading speed.
As a frontend web developer it is your responsibility to be aware of the elements that may disrupt the perceived loading speed and optimize accordingly.
Core Web Vitals
There are a bunch of metrics that can be used to measure the performance of your web platform. We refer to these as “Web Vitals”. They include:
- Time to First Byte (TTFB)
- First Contentful Paint (FCP)
- Largest Contentful Paint (LCP)
- First Input Delay (FID)
- Time to Interactive (TTI)
- Total Blocking Time (TBT)
- Cumulative Layout Shift (CLS)
.png?width=722&name=unnamed%20(3).png)
Google selects a couple of these metrics and names them Core Web Vitals. The list can change from time to time, but they all revolve around performance, perceived loading times, and the user experience.
These are the 3 Core Web Vitals that Google uses to measure the performance of your website:
.png?width=744&name=Untitled%20design%20(45).png)
There is Largest Contentful Paint, First Input Delay, and Cumulative Layout Shift. Let’s break down these terms and explain what they mean, how to measure them, what the accepted values are, and how to achieve them.
Largest Contentful Paint

Largest Contentful Paint is a performance metric that measures the render time of the largest piece of content on a page that is visible to the user. This could be an image, a video or text that is part of a content block.
The assumption is that the largest piece of content will probably be an important piece of content.
LCP is related to the TTFB in a way: if the Time To First Byte for individual resources is quite slow, your LCP score will also be low. However, resources that suffer from render-blocking but that have a good TTFB will also cause the LCP score to be low.
If the Largest Contentful Paint is loaded within 2.5 seconds, you’ll have a decent LCP score.
In the past more emphasis was put on the First Contentful Paint (FCP), which measures the render time of the first element that is visible in the browser. But because the first thing you see in the viewport of the browser is not necessarily the crucial part of the page, Google decided to promote LCP to a Core Web Vital.
Here’s how you can improve the LCP score:
- Reduce the loading time of the server
- Reduce the amount of data going over the wire through compression
- Avoid using render-blocking Javascript and CSS
- Optimize images
- Use height and width attributes for images in your HTML code
In more practical terms, you should use Gzip or Brotli compression on text-based resources to reduce the size of content over the wire. Performing minification on your Javascript, CSS, and HTML will also help to reduce the size.
Improving the LCP also means lowering the TTFB by optimizing server rendering. An HTTP cache like Varnish could be used for that. Prefetching crucial resources before they are requested by the client will also help.
When it comes to images you should optimize them by reducing the size to an acceptable level and you might want to consider using modern image formats like WebP which are specifically designed for the web.
Render blocking can be prevented by asynchronously loading non-critical CSS and Javascript resources. Lazy loading resources you only need later (when scrolling down) can also prevent render blocking.
First Input Delay
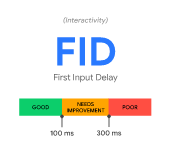
The First Input Delay (FID) is the second Core Web Vital we’ll cover. It measures the amount of time it takes for a website to become interactive after triggering an event.
It’s primarily based on the possibility of interacting with some of the visual elements of your website. This could be a hyperlink, a button, input fields, Javascript-rendered elements, …
The event that is triggered by interacting with these components takes a certain amount of time before being processed by the browser. That’s the First Input Delay.
The First Input Delay should be 100 milliseconds or less.
Potential input delay can be caused by the browser’s main thread being occupied. This prevents the browser from triggering the requested event. The main culprit for this is Javascript. If your browser has to spend a lot of time executing Javascript, the website might lack the interactiveness it requires to meet the quality of experience for the user.
Reducing the FID can be done by reducing so-called “main thread work”. Reducing the amount of CSS and Javascript that needs to be executed will contribute to a better FID.
Although reducing the size of the Javascript and CSS files will help, it’s mostly about writing efficient Javascript and CSS code.
Cumulative Layout Shift
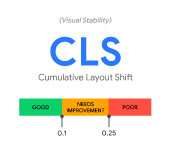
The Cumulative Layout Shift (CLS) measures the visual stability of a page. If certain actions cause the layout to shift on the page, it impacts the user experience in a negative way.
These layout shifts are for example text that moves on the screen because of an event that is triggered. CLS is not measured in seconds, it’s just a number that represents the amount of unexpected layout changes.
If the value is below 0.1, you have a decent CLS score.
Improving the CLS can be done by specifying height and width attributes for images and videos that are loaded.
You should also avoid inserting content above existing content, because it will cause the browser to repaint that content, which might result in a layout shift. The only exception is prepending content that was triggered by user input.
And finally, if you perform animations in your HTML, use transformations rather than modifying the visual properties of an element.
How to Measure the Core Web Vitals?
Google offers various ways to measure the Core Web Vitals of your website. Tools like PageSpeed Insights and the Core Vitals Report in the Search Console can be used to measure LCP, FID and CLS. There’s even a Web Vitals Chrome Extension.
However, our preferred measurement tool is the Lighthouse implementation in Chrome DevTools. Although it is a lab tool that performs simulated requests, it’s an easy way to check Core Web Vitals values.
By right-clicking on your page and selecting “inspect”, the Chrome DevTools open up and the Lighthouse tab is available for performance benchmarks.
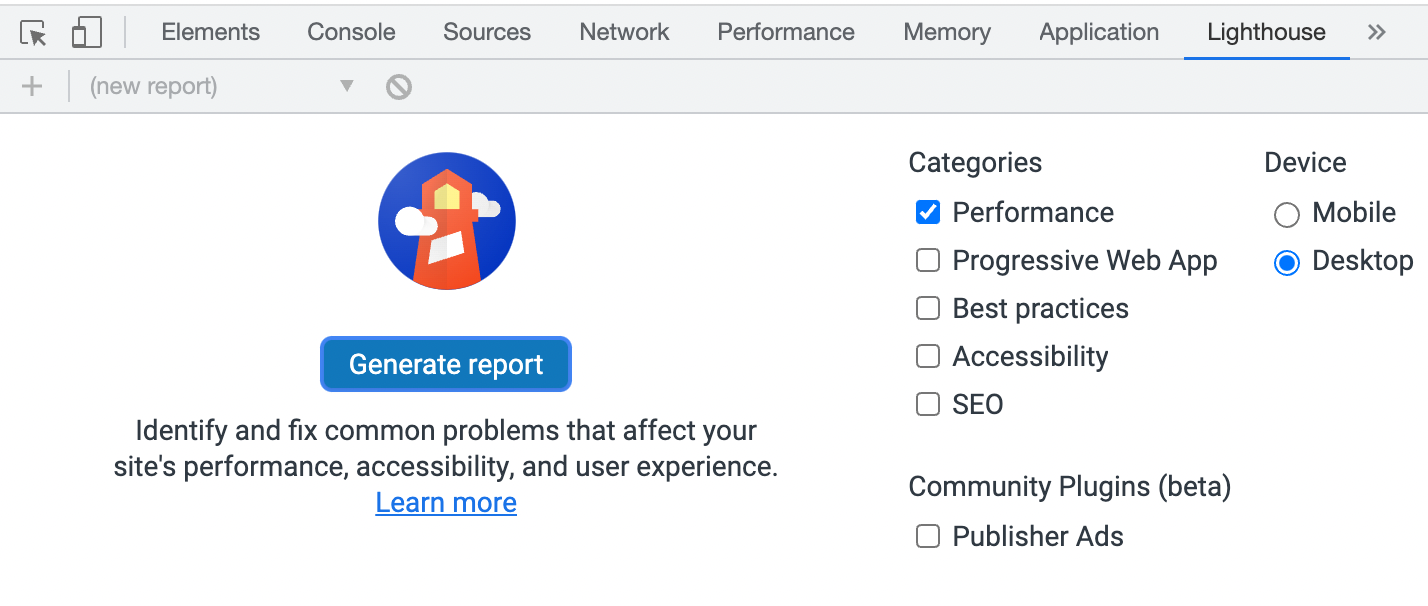
You can run a performance test and choose to simulate a desktop client or a mobile device. When the test is finished and the report is generated, this could be the output:

As you can see, the Cumulative Layout Shift and Total Blocking Time aren’t too bad. First Input Delay is not measured using Lighthouse, but Total Blocking Time is closely related.
The Largest Contentful Paint value is heavily affected when performance issues occur on the server. This is reflected in the poor score.
Lighthouse also presents some call-to-actions under the form of “opportunities”. As you can see in the screenshot below the page is very slow because it takes the server a lot of time to generate the page, the images seem to be too big and there are render blocking resources:

How to Improve the Core Web Vitals
If you want to learn more about Core Web Vitals and how to improve them using Varnish, you can register for our upcoming webinar.
In this webinar, we’ll improve the Lighthouse score of a poorly performing demo website using Varnish, the Varnish Configuration Language and a selection of VMODs.
We’ll use various techniques to:
- Reduce the time it takes to generate the output of web pages
- Reduce the size of pages, images and static assets over the wire
- Eliminate render-blocking resources
- And more!
