
Anders Nordby, Web Operations Specialist with the Møller Group in Norway, wanted to integrate Varnish Custom Statistics (VCS) with the DataDog IT monitoring and data visualization solution and wrote a blog to share how easy and useful it has been to identifying trouble spots and issues in real time.
At Møller Group, we faced a very real performance issue. We needed to know where certain database use was coming from but we didn’t have any good data showing it over time. We had database (IBM DB2) load problems in our main database, which became a major focus in the organization. On the API side, which is generally the cause of load, we were lacking data visualizing our traffic, especially where it would correlate different data so that we could more easily see what to investigate further.
I started looking at the issue by using old-school tools, such as rrdtool, with which I created some graphs. This didn’t really satisfy my need for something easy and flexible. More specifically, I wanted to skip all the configuration of data collection, such as what values to keep, how much, and so on, as this would all vary and change from one minute to the next.
I also wanted to plot an unknown number of metrics on one graph. Considering how I might do this, I wanted to find a ready-made service that could make this both easier and more powerful. I already had DataDog in mind from my earlier exploration of such services, but I hadn’t – until now – had a good use case for putting DataDog into practice. Our DB load problems were exactly the right case.
I was able to solve the entire issue in just a couple of days, sending all the data, getting all the graphs I wanted, making heaps of dashboards showing the data for different web services and even monitoring data illustrating unusual traffic. The raw JSON data provided by Varnish Custom Statistics (VCS) fits very well with the custom metrics in DataDog, and adding new graphs and metrics is a simple case of adding some logging code in VCL, looping through what I have in VCS and then either manually adding a graph or adding it to my dashboard-generating script.
Graphing VCS data in DataDog has shown real value in our organization. We can pinpoint poor response times, the level and distribution of errors, where traffic is coming from over time - making it more likely to find the actual source of problems and errors. Integrating VCS with DataDog has offered insight into performance problems and traffic errors of which we might not have been previously aware. The combination of Varnish and VCS gives us great flexibility in what to measure. I love the ease of use & generic usefulness of just adding some basic logging to VCS and getting near-real-time summarized JSON data that I can use any way I please - DataDog being a new and interesting place to put it and make powerful visualizations and correlations.
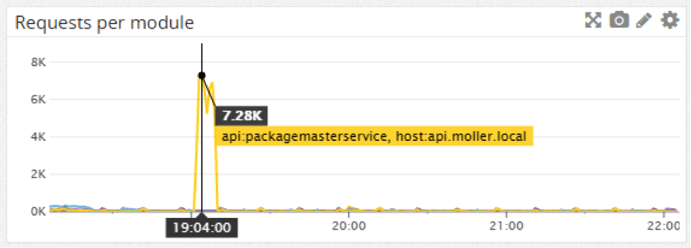
Example graph showing the number of requests per API module, where we have a big peak on one of them:
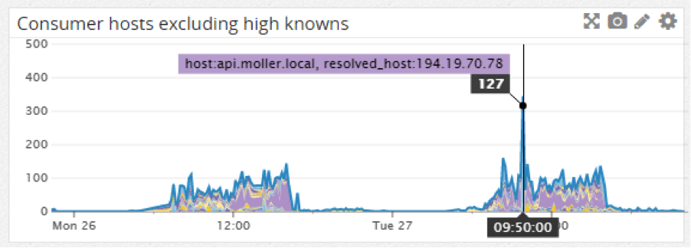
List of API consumer hosts (reverse DNS resolved), excluding the “usual suspects” shows various PCs giving an unexpectedly high number of requests:
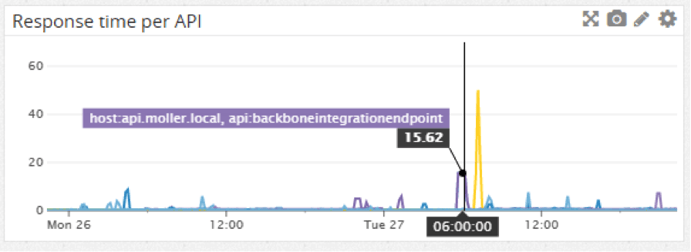
The response time per API endpoint, showing us the peaks:
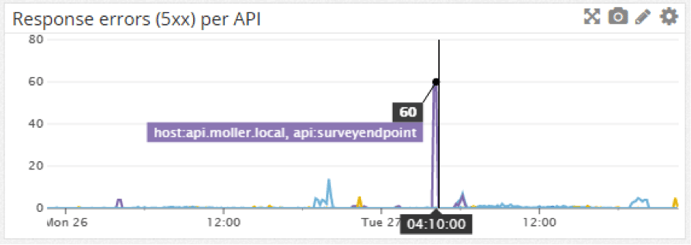
The level of errors per API:
Getting data from VCS in Ruby is a simple case of getting it with HTTParty and parsing the response body with JSON.parse. And then to submit the data to DataDog, use the dogapi gem, connect to their API and submit a
dog.emit_point("api.#{env}.requests", total["n_req"], :host => hostname)If you wish to graph more than one metric on a graph, submit them with what sets them apart in a tag:
dog.emit_point("api.#{env}.resptime_perapi",
                apidata["ttfb_miss"],
                :host =>
                hostname,
                :tags =>
                ["api:#{api}"])
This will be readily available for graphing in the Datadog UI or API where you can also set up graphs.
Interested in learning more about VCS? Download our VCS white paper.

Photo (c) 2009 Fractal Ken used under Creative Commons license.