While we have spent some time explaining all the surprising things that the Varnish private CDN solution contains under the hood, an important factor in performance is being able to understand what’s going on under the hood one level deeper, at a more diagnostic level.
Logging and metrics for troubleshooting and observability
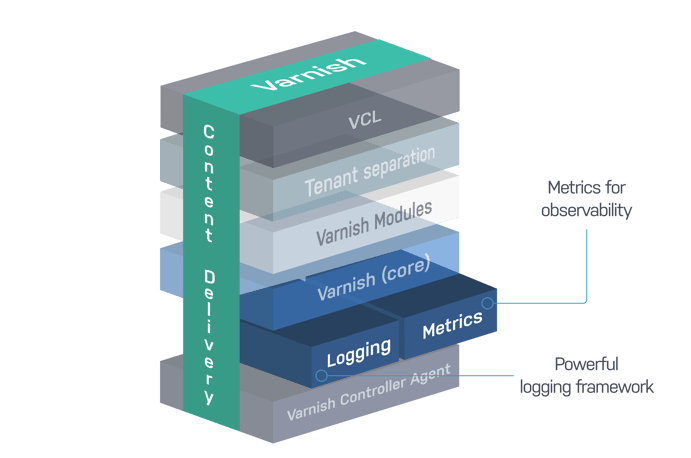
How do you know if you are achieving peak performance with your content delivery? How can you identify and mitigate what’s going wrong? Logs and metrics are a sure bet, and a necessity, for getting the full picture of your content delivery and the performance of the underlying technology. Supporting this stack is a comprehensive logging and metrics framework for traffic analysis and health monitoring, which is where Varnish does things differently.
Because logging offers invaluable data that tells you in real time what is happening in your system, whether that’s system performance or incoming security threats, we built Varnish to collect as much information as possible. Granular logging of the type Varnish automatically provides ways to enable both proactive monitoring and threat detection as well as keys for improving operations and resource usage.
Traditional logging doesn’t usually log as much data as Varnish does, and we log as much as we do both because it’s more comprehensive and because high-performance content delivery deals in extreme numbers, i.e., millions of requests per second. The more information you have, the better you will understand what is going on or what’s going wrong. However, this much data could turn into a performance nightmare in and of itself, which is why Varnish’s approach to logging is to push logs to Varnish Shared Memory (VSM), so you don’t face I/O limitations. And then smaller programs (readers) connect to VSM to transform the logs into other formats for interpretation.
Mapping high-performance content delivery: Granular logging and VMODs
Ensuring high-performance content delivery relies on having clarity on and visibility into how traffic is flowing into and out of your system, how transactions are being handled, and where the bottlenecks might be. Fundamentally Varnish logging enables an extensive overview of everything you need to understand at a deeper level than standard logging provides, i.e., there can be dozens or even hundreds of records within a single transaction, and Varnish can capture all the layers of that transaction to get a complete overview.
Similarly, if you need to understand traffic in granular detail, for example, know how many requests came in and what size they were (common for a CDN or an API gateway), you will need to have this traffic data in detail. Varnish accomplishes this as well.
Want to learn more about using Varnish for logging and metrics? Watch the on-demand webinar.